

Alarming Voting Pattern Emerges From The 2024 Presidential Election
Unveiling Election Vulnerabilities: How Clark County's Anomalies Expose the Urgent Need for Security and Transparency.

In the aftermath of the 2024 U.S. Presidential Election, a grassroots organization you’ve probably never heard of has emerged as a beacon of transparency and accountability — the Election Truth Alliance (ETA). Founded in December 2024, ETA is a non-partisan, non-profit group dedicated to safeguarding the integrity of elections through meticulous data analysis and advocacy. So far, their work has uncovered significant anomalies in Clark County, Nevada—an area pivotal to the election's outcome.

What ETA Found
Clark County, home to approximately 1.5 million registered voters, became the focus of ETA's investigation due to unusual voting patterns in Early Voting results. The county's voter registration is diverse, with 485,000 Democrats, 393,000 Republicans, and 646,000 third-party or unaffiliated voters. This diversity makes it a microcosm of broader electoral trends, and any irregularities here could have far-reaching implications.
ETA's analysis revealed discrepancies in Early Voting data that deviate from expected human voting behavior. These findings raise critical questions about the integrity of the election process and highlight the need for further investigation. The organization's commitment to transparency and data-driven advocacy has made it a vital player in the ongoing conversation about election security.
Unpacking the Anomalies: What the Data Reveals
The Election Truth Alliance's analysis of Clark County's voting data has uncovered patterns that challenge the norms of expected human voting behavior. These findings are not just numbers on a page—they tell a story of potential irregularities that demand attention.
The Drop-Off Difference
One of the most striking anomalies is the difference in "drop-off rates"—the percentage of voters who cast a ballot for the Presidential race but skipped voting for down-ballot candidates. In Clark County, Trump’s drop-off rate was a staggering +10.54%, compared to Harris’s +1.07%. This means a significantly higher number of Trump voters chose not to vote for other Republican candidates, a pattern that stands out as unusual and warrants further scrutiny.
Early Voting Discrepancies
Early Voting data reveals a consistent pattern: Trump received closer to 60% of the votes, while Harris hovered around 40%. This trend was particularly pronounced in tabulators processing a higher volume of ballots. In contrast, Mail-In and Election Day voting showed more balanced results, with Harris leading in Mail-In votes and a near tie on Election Day. The stark difference in Early Voting raises questions about what might have influenced these results.
Clustering and Uniformity
The data also shows abnormal clustering in tabulators that processed over 250 ballots. Instead of the expected variability in human voting behavior, these tabulators exhibited a high degree of uniformity. This kind of consistency is rare in organic voting patterns and could indicate external influences on the voting process.
Visualizing the Anomalies
Scatter charts and histograms were used to analyze the data, and the results are telling. Scatter charts showed a clear shift in voting patterns between low-volume and high-volume tabulators. Histograms revealed a sharp spike in Trump’s vote distribution during Early Voting, resembling a phenomenon known as the "Russian Tail." These visual tools make the anomalies not just evident but undeniable.
The Role of CVR Data
At the heart of the Election Truth Alliance's findings is the Cast Vote Record (CVR) data. This dataset, publicly available from Clark County's election office, served as the foundation for their analysis. Its significance cannot be overstated—here’s why:
A Detailed Snapshot of Votes
CVR data provides a comprehensive, ballot-by-ballot record of how votes were cast and processed. It includes information on whether ballots were submitted via Mail-In Voting, Early Voting, or Election Day voting. Importantly, it also identifies the tabulation machines that processed the ballots, making it possible to correlate voting patterns with specific machines.
Transparency and Accountability
This level of detail enables independent validation of election results, a cornerstone of transparency in democratic processes. Analysts can scrutinize the data for irregularities, as the Election Truth Alliance did, shedding light on anomalies that might otherwise have gone unnoticed.
Spotting the Patterns
By leveraging CVR data, the organization identified troubling patterns in Clark County. For example, the data revealed abnormal clustering and uniformity in Early Voting results, as well as sharp discrepancies linked to high-volume tabulators. These insights were critical in building their case for further investigation.
Machine-Level Anomalies
Since the data is tied to specific tabulators, it allowed the Alliance to pinpoint machines or locations that displayed unusual behavior. This adds a layer of accountability, as it highlights potential vulnerabilities in the voting infrastructure.
In sum, CVR data is not just a tool for analysis—it’s a safeguard for election integrity, allowing citizens and experts alike to verify that every vote is counted accurately.
Visual Evidence: Graphs Tell the Story
Sometimes, data can be overwhelming, but visuals like graphs make complex information easier to understand. The Election Truth Alliance effectively utilized visual tools to highlight the anomalies in Clark County's voting data.
"Messy is Normal, Clean is Not"
One of the most striking visualizations is the graph titled "Clark County, Nevada Election Data Indicates Manipulation." It divides voting data into two categories: "Messy is Normal" and "Clean is Not." The scattered points in the "Messy" section represent typical, human voting behavior—unpredictable and varied. In stark contrast, the "Clean" section shows a cluster of organized points that appear too uniform to be organic. This clean clustering aligns with the abnormalities found in Early Voting data, where high-volume tabulators displayed unusual uniformity.
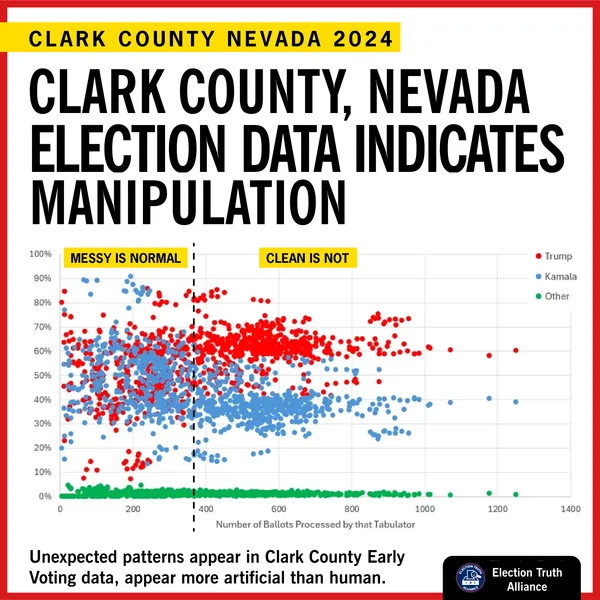
Scatter Charts: Tracking Voting Patterns
Scatter charts were employed to compare voting patterns across tabulators processing different numbers of ballots. A clear shift was evident: in tabulators processing fewer than 250 ballots, Harris had the lead, but in those processing over 250 ballots, Trump consistently surged ahead. This dramatic change suggests a non-organic influence affecting high-volume tabulators.
Visualizing the "Russian Tail"
Histograms showed an unexpected spike in Trump’s vote distribution during Early Voting, forming a pattern resembling the "Russian Tail," a known signal of potential data manipulation. This visualization highlighted deviations from normal distribution, making it easier to identify the anomalies.
These graphs do more than present numbers—they illustrate a story of potential irregularities that might otherwise be hidden in dense data tables. By bringing these patterns to light, the Election Truth Alliance has created a compelling argument for further investigation.
Implications and the Road Ahead
The findings from the Election Truth Alliance's analysis are not just a call to action—they're a wake-up call for anyone who values the integrity of democratic processes. The anomalies in Clark County's voting data suggest that something went awry, particularly during Early Voting. While the exact cause remains uncertain, the patterns point to potential election interference or manipulation that demands further investigation.
What This Means for Election Integrity
The irregularities in Early Voting data—such as abnormal clustering, drop-off rate discrepancies, and the "Russian Tail" phenomenon—highlight vulnerabilities in the electoral system. These issues are not just about one election; they raise broader concerns about the security and transparency of voting processes nationwide. If such anomalies can occur in Clark County, what's to say they aren't happening elsewhere?
ETA's Ongoing Work
The Election Truth Alliance is not stopping here. Their next steps include sharing their findings with local media, politicians, and election experts to raise awareness and demand accountability. They are also advocating for investigative measures, such as hand recounts and audits, to verify the accuracy of the results. Additionally, they are calling for greater transparency in election data and the security of voting machines.
They are currently working on analyzing 2024 election data from:
Pennsylvania
North Carolina
Wisconsin
Arizona
Michigan
Georgia
How You Can Help
ETA's work relies on public support. Whether it's volunteering, donating, or simply spreading the word, there are many ways to contribute to their mission. By standing together, we can ensure that every vote is counted accurately and that the democratic process remains fair and transparent.
The Election Truth Alliance's work in Clark County, Nevada, underscores the importance of vigilance in safeguarding democracy. Their findings reveal troubling anomalies that demand further investigation, not just for the sake of one election but for the integrity of the entire electoral process. By shining a light on these issues, ETA reminds us that transparency and accountability are the cornerstones of a healthy democracy. The road ahead may be challenging, but with continued advocacy and public support, we can ensure that every vote truly counts.
If you would like to read their final report on Clark County, NV, you can download it HERE.
If you enjoyed this article, please subscribe to Pulse Network, and share it with your friends! Thank you for supporting independent media.
Elon rigged the voting system. Trump admitted it.
It's taking 5 months to find all this out. We need to help and do more to get this going faster.